Unlicensed Betting Sites Record Sharp Rise in British Traffic According to New IFHA Data
Ulrich Keller · Nov 9, 2026
Unlicensed Betting Sites Record Sharp Rise in British Traffic According to New IFHA Data
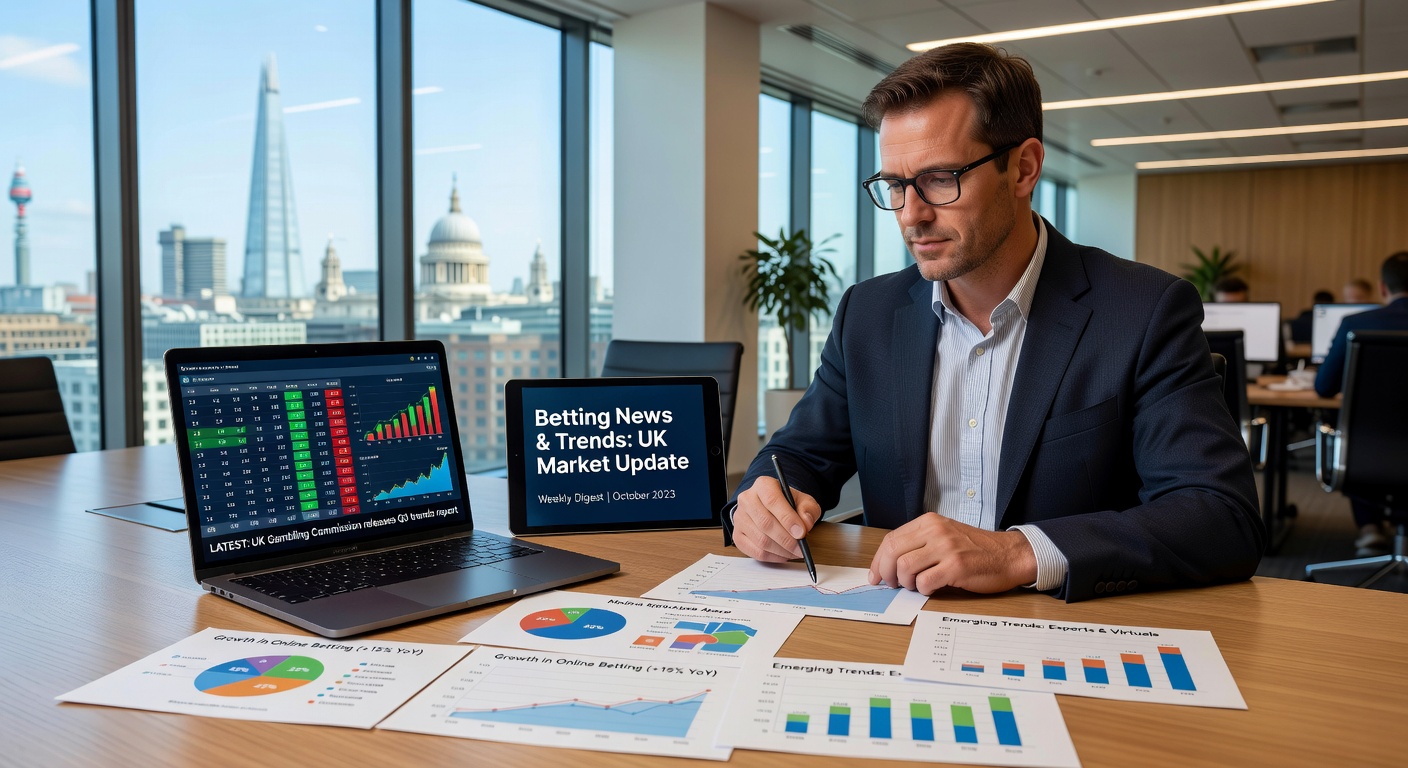
Observers note that a fresh report from the International Federation of Horseracing Authorities details how unlicensed betting sites in Britain logged 19.4 visits for every 100 visits to licensed platforms during the first seven months of 2026, which works out to roughly one in five compared to the one per 100 ratio recorded in late 2021, and researchers point out that monthly unique visits to the sampled illegal sites climbed from 1.8 million in 2022 to more than 25 million by 2025, representing a 14-fold jump while visitors spent 32 percent longer on those platforms and viewed 34 percent more pages overall.
Experts who examined the figures explain that the pattern emerged steadily across recent years, with the data covering activity tied to sites offering British horseracing and the increases appearing consistent across multiple months rather than isolated spikes, and those who've reviewed the full dataset note that the growth in traffic coincided with broader changes in how people access online betting options.
Key Metrics from the IFHA Analysis
The International Federation of Horseracing Authorities compiled its findings through the Council on Anti-Illegal Betting and Related Crime, where analysts tracked sampled illegal sites and compared their performance against licensed alternatives, and the resulting numbers show that traffic ratios shifted from minimal levels in 2021 to significantly higher shares by 2026, with the seven-month window providing a clear snapshot of ongoing trends without relying on single-month anomalies.
Figures reveal that unique monthly visitors expanded dramatically over the three-year span from 2022 to 2025, while session durations and page views both rose by more than 30 percent, and researchers indicate these metrics together paint a picture of deeper engagement rather than brief or casual interactions with the unlicensed platforms.
Supporting Data from the Gambling Commission Survey
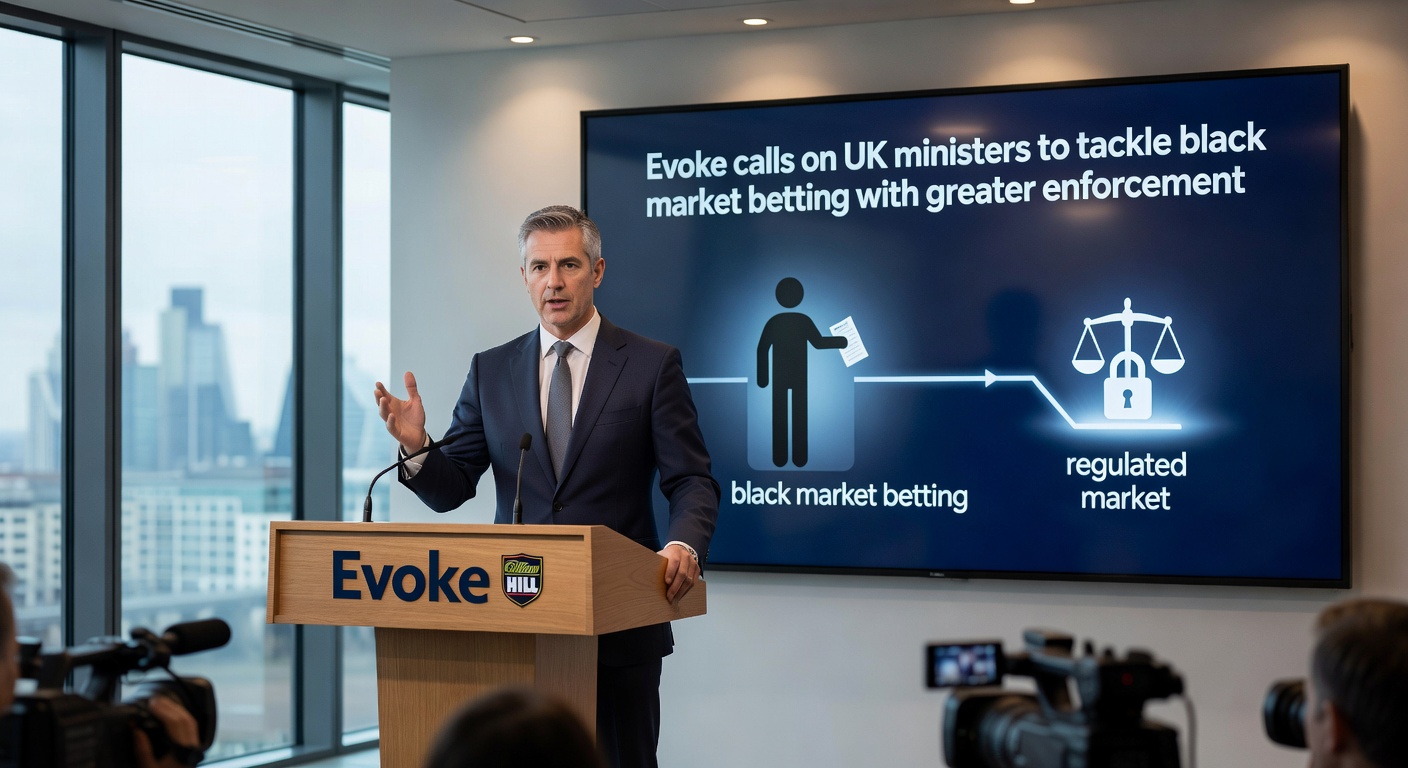
A separate survey released by the Gambling Commission the week before the IFHA report found that 2.5 percent of adults in Great Britain who gambled online during the previous year had used an illegal site in the four weeks leading up to the survey, and this percentage aligns with the traffic growth patterns documented in the horseracing authority findings, creating a combined view of both behavioral reports and direct site measurements.
Those who've cross-referenced the two sources note that the survey captured self-reported usage among a representative adult sample while the IFHA data focused on actual visit logs from monitored sites, and the overlap between the two sets of information strengthens the overall understanding of how unlicensed activity has expanded since the earlier baseline period in 2021.
Context Around the 2026 Reporting Period
By November 2026 the first seven months of data had already been analyzed and released, allowing observers to compare current ratios directly against the late 2021 figures and the intermediate yearly totals, and analysts highlight that the 14-fold rise in unique visits occurred alongside the increased time spent and pages viewed, suggesting sustained interest rather than one-off exploration of the unlicensed options.
People familiar with the horseracing sector point out that the sampled sites specifically included those offering British races, which ties the numbers closely to local events and schedules without extending into unrelated international markets, and this focus keeps the report grounded in measurable activity connected to domestic competitions.
Conclusion
The combined evidence from the International Federation of Horseracing Authorities and the Gambling Commission survey provides a factual baseline of how unlicensed betting traffic in Britain has grown between late 2021 and the first half of 2026, with the reported ratios, visitor counts, and engagement metrics offering concrete points for further monitoring, and additional updates from these organizations continue to track developments in the months ahead. Read the full report summary here.